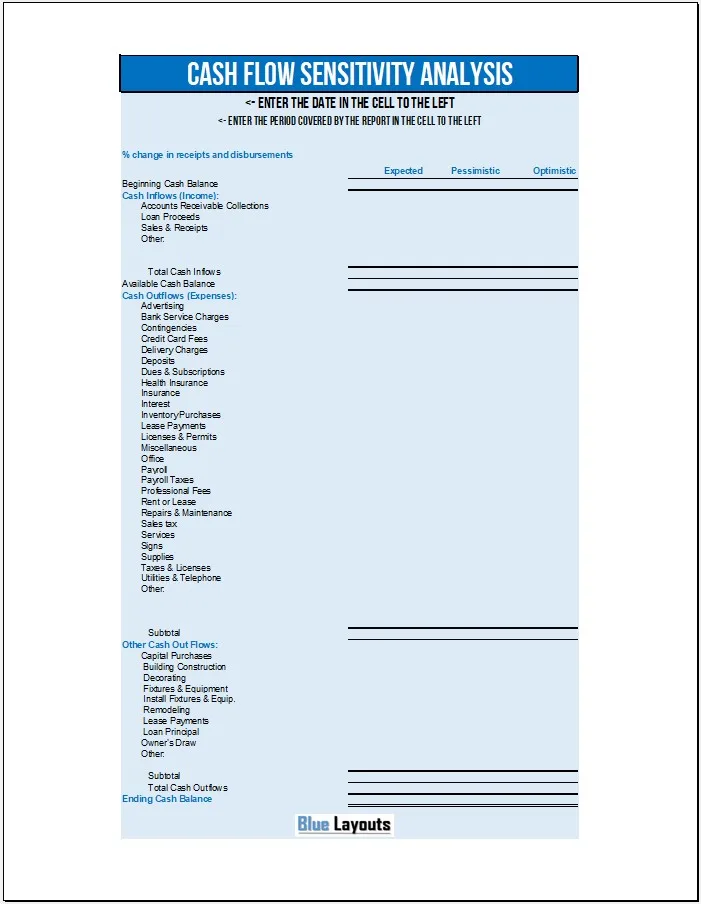
A cash flow sensitivity analysis template helps you explore how changes in receipts and payments could affect your ending cash balance. Start with a realistic cash forecast, change selected assumptions, and compare how much cash remains under each set of conditions.
The free Excel workbook below includes an expected case and two percentage-based comparison columns. Review its scenario formulas before using the results: the original file changes receipts and payments in the same direction, so its “pessimistic” and “optimistic” headings do not necessarily identify the worst and best cash outcomes.
Preview of the Excel worksheet. Select the image to view the layout at full size.
Extract the ZIP file, open the workbook in Microsoft Excel, and save a working copy before editing. The download does not include separate Word or PDF versions.
What the Spreadsheet Includes
Report details: Date and reporting period fields.
Starting cash: An expected beginning balance that is copied into the comparison columns.
Cash inflows: Accounts receivable collections, loan proceeds, sales and receipts, and other entries.
Operating payments: Categories such as advertising, insurance, inventory purchases, payroll, rent, taxes, and utilities.
Other cash outflows: Capital purchases, construction, equipment, loan principal, owner’s drawings, and other payments.
Calculated balances: Total inflows, cash available, total outflows, and ending cash for each column.
The workbook is a single-period comparison, rather than a linked monthly forecast or a probability model. For a month-by-month starting forecast, use our cash budget worksheet.
How to Prepare the Expected Cash Forecast
1. Define the period and opening balance
Choose a specific period, such as April 2027, and one currency. Enter opening cash in D8. Keep the scope consistent: if the forecast covers several bank accounts, transfers between those accounts should not become additional external receipts and payments.
2. Enter cash receipts in column D
Use the amounts expected to arrive during the reporting period. An invoice issued during the month may be collected later. Avoid recording the same customer payment under both sales receipts and accounts receivable collections.
Our monthly sales projections template can support sales planning, but translate sales into expected collection dates before bringing them into this cash forecast. Loan proceeds increase cash without being sales revenue.
3. Enter payments in column D
Include cash expected to leave during the period, including applicable equipment purchases, loan principal repayments, and drawings. These movements matter to cash even when they are treated differently in a profit calculation. Enter positive payment amounts because the ending-balance formula subtracts the outflow total.
Check overlapping categories. For example, use the appropriate lease-payment line once, rather than repeating the same payment in both sections. Allocate a purchase across the relevant categories without counting its full value twice.
4. Reconcile the expected ending cash
The basic relationship is ending cash = beginning cash + cash receipts − cash payments. Compare the worksheet’s result with a separate calculation before introducing scenarios. See the Australian Government’s cash flow preparation guide for further explanation of incoming cash, outgoing cash, and closing balances.
How the Original Scenario Formulas Work
Enter the percentage in D6 using Excel’s percentage format, such as 10%. Entering 10 as an ordinary number represents 1,000%, not 10%.
Original worksheet calculation logic
Column
Original heading
Treatment of positive receipts and payments
D
Expected
Amounts entered by the user.
E
Pessimistic
Multiplies both receipts and payments by 1 minus D6.
F
Optimistic
Multiplies both receipts and payments by 1 plus D6.
Why the labels need care: Lower payments can offset lower receipts, while higher payments can offset higher receipts. If expected payments exceed receipts, the column labeled “optimistic” can produce less ending cash than the expected case. Treat these as uniform decrease and increase comparisons unless you deliberately revise the assumptions.
The existing scenario formulas also leave entries blank when the percentage is zero or empty, or when the corresponding expected amount is zero or negative. A blank scenario is therefore not evidence that the expected cash movements have been carried across. Several total formulas suppress zero totals as well. Review blanks and zero results explicitly.
Example: Uniform Change Versus a Cash Stress Test
Suppose opening cash is 5,000, receipts are 20,000, payments are 18,000, and the change percentage is 10%. The following hypothetical amounts use one currency.
Illustrative ending cash under different assumptions
Case
Receipts
Payments
Ending cash
Expected
20,000
18,000
7,000
Original column E: both down 10%
18,000
16,200
6,800
Original column F: both up 10%
22,000
19,800
7,200
Separate stress test: receipts down 10%, payments up 10%
18,000
19,800
3,200
The stress test exposes a larger reduction in available cash because receipts and payments move in opposite directions. It is an additional example, not the scenario automatically calculated by the original download.
Build More Useful Scenarios in a Working Copy
Rename the existing scenario columns if you retain the uniform-change approach. For a separate downside case, document which receipts could fall, which payments could rise, and which commitments should stay fixed. A signed loan advance, fixed rent, and variable inventory purchases do not necessarily respond to the same percentage.
For example, in a separate working copy, an affected receipt based on D10 could use =D10*(1-$D$6), while an affected payment based on D19 could use =D19*(1+$D$6). A fixed payment could use =D19. These are suggested edits, not corrections already installed in the download. Apply them only to the appropriate rows and check totals afterward.
Test a zero-percent case: all scenario amounts should match the expected case when that is your intended logic. Then test a known percentage and compare ending cash independently. Keep written assumptions beside the analysis or on a separate sheet.
A period-end surplus does not prove cash stays positive throughout the period. If a large payment falls before customer collections, prepare a weekly or daily schedule. For longer planning horizons, our five-year projections template provides a broader financial summary.
Cash Flow Sensitivity Analysis FAQs
Is this a free Excel template?
Yes. The download above contains an Excel workbook in a ZIP archive. Review the site’s usage terms before redistributing it.
Does it compare budget with actual cash flow?
It has expected and scenario columns, not a dedicated budget-versus-actual comparison. Keep actual transactions and forecast versions separately labeled.
Does the workbook calculate a true best and worst case?
Not automatically. Its original formulas change receipts and payments together. Define appropriate assumptions and review or revise the formulas before describing a scenario as best or worst.
Can I use it in Google Sheets?
You can try importing the .xlsx file. Verify the formulas, merged cells, percentage formatting, and print layout after import before relying on the results.
Is ending cash the same as profit?
No. Ending cash includes the opening balance and the cash movements entered for the period. Borrowing, principal repayments, purchases, and collection timing can affect cash differently from profit.