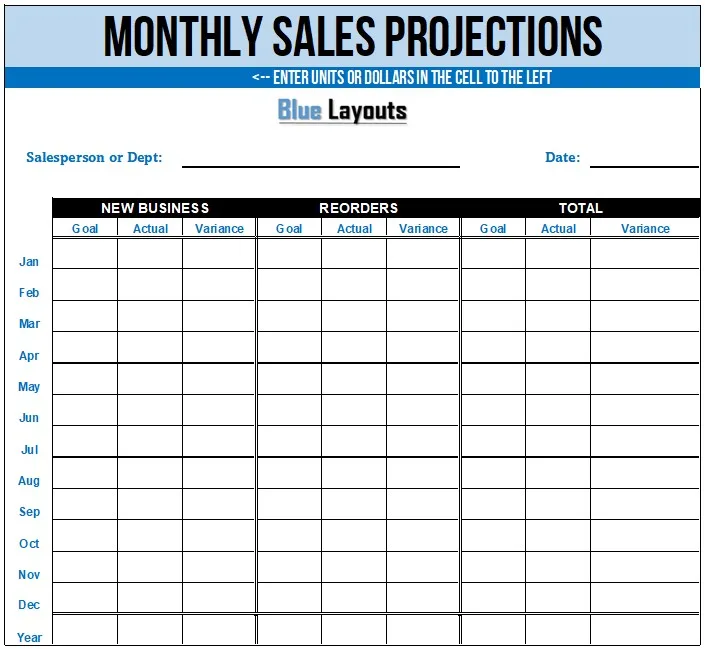
Plan and review monthly sales with this monthly sales projections template for Excel. Set goals for new business and reorders, enter actual results and compare the differences over a 12-month period.
The workbook calculates totals and variances from figures you supply. It does not generate a forecast automatically from past sales, market data or a pipeline. Its structure is a goal-versus-actual tracker, so document how the goals were estimated and distinguish a forecast from a management target.
Download the Monthly Sales Projections Excel Template
Format: ZIP containing one Excel XLSX workbook. It includes a visible Template sheet and a hidden configuration sheet. The main worksheet has 12 month rows, a Year total row, salesperson/department and date fields, and an instruction to identify units or dollars.
Extract the ZIP, open the workbook in Excel and save a working copy. Add the year or full reporting date range explicitly because month labels alone do not identify the year. A separate Word or PDF version is not included.
What does the worksheet track?
Group
Columns
Purpose
New Business
C: Goal; D: Actual; E: Variance
Planned and achieved sales classified as new business.
Reorders
F: Goal; G: Actual; H: Variance
Planned and achieved repeat sales under your definition.
Total
I: Goal; J: Actual; K: Variance
Combined new-business and reorder figures.
Months and annual summary
Rows 13–24; totals in row 25
A 12-month view with column totals.
Define the two sales groups so every sale is assigned once. For example, specify whether a new product sold to an existing customer is new business or a reorder. Keep that definition consistent across salespeople and months.
Choose one measurement basis. If using revenue, identify the currency and treatment of returns, discounts and sales taxes. If using quantities, use comparable units; adding different services or pack sizes into a single unit total may not be meaningful.
How to build a monthly sales projection
Define the scope. Enter the department or salesperson, period, units/currency and preparation date. State whether the Goal columns are targets or evidence-based forecasts.
Establish a baseline. Review comparable historical results and explain exceptional sales, discontinued products or unusual periods.
Estimate new business. Use relevant demand, expected conversion, average order value and delivery capacity. Keep the underlying assumptions separately.
Estimate repeat business. Consider expected customer activity, order frequency, cancellations and retention rather than assuming every previous sale will repeat.
Allocate by month. Reflect seasonality, planned launches, trading days and constraints rather than automatically dividing an annual figure by 12.
Enter actual results. Use reconciled sales records and the same classification basis as the goals.
Review differences. Record explanations and future changes while preserving the original plan for comparison.
The monthly sales seasonality template provides a separate resource for reviewing monthly patterns. Seasonality should inform your assumptions; it is not automatically calculated by this projections workbook.
Understand the variance and total formulas
The original variance convention is Actual − Goal. A positive number means sales exceed the stated goal; a negative number means they fall short. It is an amount variance, not a percentage.
The monthly totals add new business and reorders, and row 25 adds each column across the 12 months. Some totals allow partial inputs, so check completeness before treating a combined figure as final. The annual formulas also hide a zero sum, which can make a genuine zero total or offsetting variances appear blank.
Optional numeric-input checks
The original monthly formulas use CELL type checks. If you want explicit numeric-input checks and combined monthly totals only when both components are entered, these are optional replacements for the first month:
Cell
Optional formula
E13
=IF(COUNT(C13:D13)=2,D13-C13,"")
H13
=IF(COUNT(F13:G13)=2,G13-F13,"")
I13
=IF(COUNT(C13,F13)=2,C13+F13,"")
J13
=IF(COUNT(D13,G13)=2,D13+G13,"")
K13
=IF(COUNT(I13:J13)=2,J13-I13,"")
Copy these down through row 24. Enter a numeric zero when a completed category genuinely has no sales; leave an unreported result blank. Do not enter a text dash as a zero.
To show zero annual sums when numeric entries exist, replace C25 with =IF(COUNT(C13:C24)=0,"",SUM(C13:C24)) and copy across through K25. This still totals the entries available; it does not certify that all 12 months are complete. These optional changes are not installed in the original download.
Compare year-to-date results with year-to-date goals
A partial-year actual total should not be presented as though it covers a full-year goal. For a report through June in a January-start sheet, compare the same first six month rows in both columns. Keep future actual cells unreported and label the cutoff clearly.
For a current outlook, maintain a separate view of completed-month actuals plus remaining-month forecasts. Do not overwrite the original goal simply to eliminate an unfavorable variance.
Worked monthly sales example
This fictional example uses revenue in one currency and complete inputs for the month.
Sales group
Goal
Actual
Actual − Goal
New business
10,000
9,000
−1,000
Reorders
6,000
7,000
1,000
Total
16,000
16,000
0
The total goal was met, but the sales mix changed. A zero total variance does not mean both categories performed as planned. Review the new-business shortfall and reorder increase separately.
If you add a percentage variance for new business, it is (9,000 − 10,000) ÷ 10,000 = −10%. A percentage needs a defined nonzero goal; do not divide by zero or call an undefined result 100% growth.
Set up a different 12-month period carefully
B13 contains the starting month label. The following labels use a helper month table based on its first three letters. A recognized English abbreviation such as Apr can shift the sequence to April–March. Check all 12 labels after changing it and identify both years where needed.
Do not edit the helper month table casually. Relabel the Year row to show the actual fiscal or reporting period if the sheet does not cover January–December.
Sales projections, profit and cash collections are different
This workbook does not contain product costs, gross margin, operating expenses or a profit calculation. A higher sales figure can coexist with lower margins. It also does not schedule when customers pay.
Use a cash budget worksheet to plan collection and payment timing separately. If you forecast by channel, reconcile the categories with your sales channel analysis so orders are not duplicated between views.
For a longer planning horizon, the five-year projections template offers another summary layout. Keep short-term evidence and longer-term assumptions identifiable rather than treating a detailed monthly plan as a guarantee.
Frequently asked questions
Does the spreadsheet generate sales forecasts automatically?
No. You supply goals and actuals. The workbook adds categories and calculates differences; it does not infer demand, conversion or seasonal factors.
Can I use units instead of money?
Yes. Identify the measurement in the heading and use comparable units consistently. Do not mix currency and quantities in the same columns.
Why can a zero annual variance appear blank?
The original annual formula returns blank when its sum is zero. Review the underlying monthly figures or use the optional numeric-count total formula above.
Can I use it for a salesperson or department?
Yes. The worksheet includes a Salesperson or Dept field. Use separate copies where needed and define how shared sales are allocated.
Is there a built-in forecast accuracy score?
No. Amount variances are not an accuracy percentage or confidence level. No universal forecast accuracy rate is supplied by the template.
Can I use Google Sheets or print a PDF?
You can try importing the XLSX or exporting a checked PDF. Verify monthly labels, formulas and formatting afterward, including any optional changes.


Pingback: Free Monthly Sales Seasonality Template for Excel