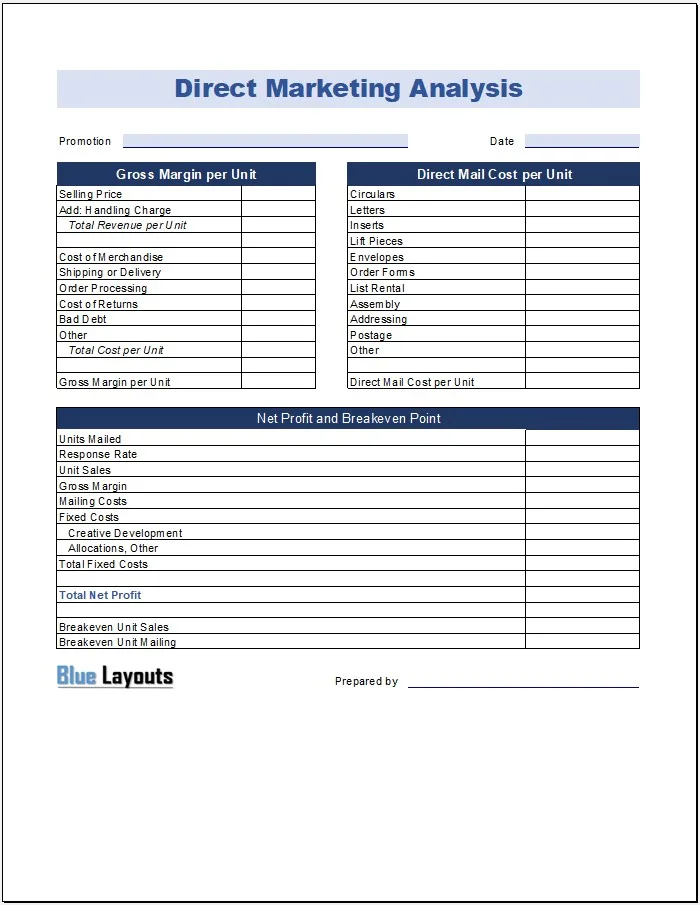
Estimate the economics of a direct-mail campaign with this direct marketing analysis template for Excel. The workbook combines revenue and costs per sale, mailing costs per piece, mailing volume, a response-rate assumption, and fixed campaign costs.
Important limitation: the supplied break-even formulas need correction. Use the worksheet as a planning layout and review its assumptions before relying on the outputs. The guide below distinguishes the existing calculations from the corrected break-even approach.
The file contains calculation formulas, but its Breakeven Unit Sales and Breakeven Unit Mailing outputs are not reliable as supplied. It does not import campaign data, track customers, or retrieve email or advertising metrics.
Campaign Analysis Worksheet Preview
The original separates costs per sale from costs per mailed piece. Preserve that distinction when entering data and rebuilding break-even formulas.
What the Workbook Calculates
Section
Calculation or input
Revenue per unit sold
Selling price plus the handling charge collected
Cost per unit sold
Merchandise, shipping, processing, returns, bad debt, and other entered costs
Margin per unit sold
Revenue per sale minus the entered per-sale costs
Mailing cost per piece
Entered production, assembly, list, addressing, postage, and other mailing costs
Unit sales
Units mailed multiplied by Response Rate
Mailing costs
Units mailed multiplied by mailing cost per piece
Fixed costs
Creative development plus allocations or other fixed costs
Total Net Profit
Modeled sales margin minus mailing costs and fixed costs
The workbook calls the per-sale result Gross Margin, but it subtracts more than merchandise cost. Treat it as the model’s margin after the listed per-sale expenses, and define the scope rather than assuming it matches your accounting reports.
How to Enter a Campaign Scenario
Save a working copy. Enter the promotion name, preparation date, and the currency used.
Define one sales unit. Decide whether it means an order or an individual product, and keep the price, costs, and response assumption consistent.
Enter per-sale economics. Use D9 and D10 for revenue inputs, and D13:D18 for per-sale costs.
Enter mailing costs per piece. Use the labeled input rows in H9:H19. Enter per-piece amounts here rather than the whole campaign budget.
Set volume and response. Enter units mailed in H24 and the rate in H25, using percentage notation such as 4%.
Enter fixed costs. Use H30 and H31 for campaign-level costs not already allocated to each sale or mailing piece.
Review profit and break-even separately. Check the net-profit calculation and replace the break-even logic before using those outputs.
Use the quarterly marketing budget template for broader spending plans. Avoid entering the same cost in both a per-piece amount and fixed costs.
Clarify What Response Rate Means
The formula assumes every response produces one sales unit. If you enter an inquiry rate, it treats inquiries as sales, which can overstate results.
For a simple one-order-per-conversion model, enter the proportion of mailed pieces expected to generate an order. Alternatively, add separate response, conversion, and units-per-order inputs. Document the attribution period and how you count duplicate responses or repeat orders.
The worksheet does not establish that recorded orders were caused by the campaign. Keep tracking references and distinguish scenario assumptions from measured results.
Why the Original Break-Even Formulas Need Correction
The supplied H36 formula divides fixed costs by per-sale margin minus mailing cost per piece. Those amounts use different bases: a sale can require many mailed pieces. H37 then divides that result by the response rate, so the mismatch carries into the mailing-volume estimate.
For a fixed mailing volume, let N be pieces mailed, c be cost per mailed piece, F be fixed campaign cost, and m be margin per sale before campaign mailing and fixed costs:
Break-even sales = (N × c + F) ÷ m.
Break-even sales rate = (N × c + F) ÷ (N × m).
Using the original cell layout, the underlying calculations are =(H24*H21+H32)/D21 for sales and =(H24*H21+H32)/(H24*D21) for the rate. Use valid positive volume and margin, handle zero inputs explicitly, and round sales upward where whole sales units are required.
For a variable mailing volume at a fixed sales rate r, break-even pieces are F ÷ (r × m − c), only when r × m − c is positive. The corresponding cell expression is =H32/(H25*D21-H21). If that contribution per mailed piece is not positive, increasing volume does not cover positive fixed costs under these assumptions.
Checked Campaign Example
Assume 10,000 mailed pieces, a mailing cost of 0.50 each, a 4% sales rate, margin of 20 per sale, and fixed costs of 1,000:
Expected sales: 10,000 × 4% = 400.
Sales margin: 400 × 20 = 8,000.
Mailing costs: 10,000 × 0.50 = 5,000.
Modeled profit: 8,000 − 5,000 − 1,000 = 2,000.
Break-even sales for that fixed mailing: 6,000 ÷ 20 = 300.
Break-even sales rate: 300 ÷ 10,000 = 3%.
These are illustrative inputs, not campaign benchmarks. The original break-even outputs do not implement this fixed-volume calculation.
Review Scenarios and Results
Save separate base, lower-response, and higher-cost copies to examine how assumptions affect the result. Keep the same cost definitions and reporting period when comparing versions.
No. Its original inputs focus on direct mail, including envelopes, inserts, assembly, and postage. Digital campaigns need different cost and conversion definitions.
Does it include formulas?
Yes. It calculates revenue, costs, modeled sales, and profit. The break-even formulas require correction as explained above.
Why are some outputs blank?
Several formulas hide outputs when their conditions are not met. A blank is not automatically a valid zero. Check inputs and formulas.
Does Total Net Profit include every business expense?
No. It includes only the costs entered into the model. It does not automatically add taxes, overhead, later customer activity, or other omitted items.
Can I print the analysis?
Yes. Check Print Preview and retain a dated copy showing the assumptions used. The downloadable workbook itself remains unchanged.